Complex models typically use a lot of Visual Logic. Best practices in programming dictate that it is best to write generic procedures that are called from different places rather than duplicating the same code all over the model. However, when a generic procedure is called, how do you know what simulation object called that procedure when you are debugging the model at runtime? The answer to this question is to use the call stack. The call stack allows you to jump back and forth between the procedure that is called and the calling procedure(s).
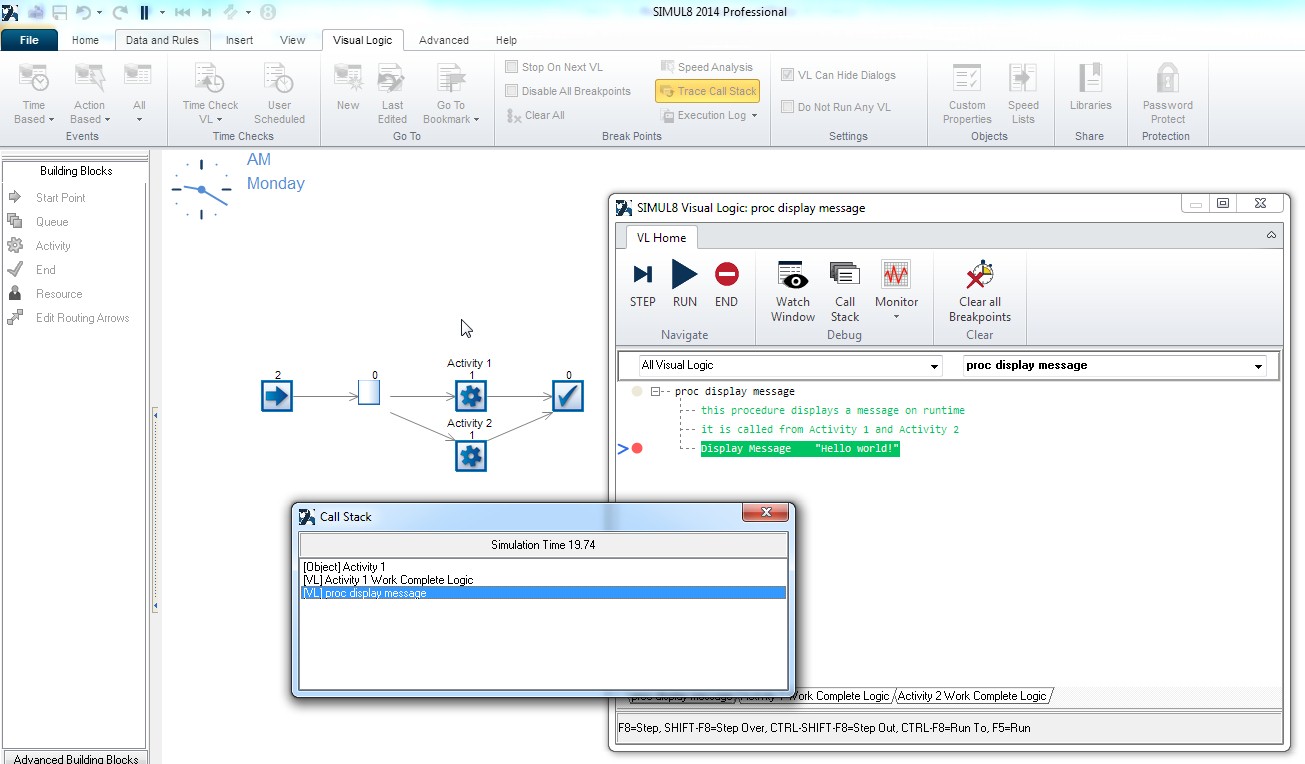
The screenshot shows a generic procedure called “proc display message”. This procedure is called by Activity 1 and Activity 2. I put a breakpoint on the display message line so that the section pops up when the procedure is called. I may wonder which of the two activities called this code, so I will use the call stack to determine just that. The way to use the call stack is to enable it prior to the start of the run. Click on the Trace Call Stack button on the Visual Logic tab on the ribbon. Now run your model until it hits the breakpoint. Now use the key combination Ctrl+Alt+S. This brings up the Call Stack dialog where you can see what section of Visual Logic called proc display message. In this case it is the section Activity 1 Work Complete Logic on Activity 1. We can double click on this section to open it and to inspect all variable values, etc. This functionality is extremely powerful for debugging complex models.
About the author

Sander Vermeulen
Sander has been part of the simulation community for 16 years. During his time at SIMUL8 Corporation he has managed large simulation projects for Fortune 50 companies across a variety of industries including manufacturing, defense, call center and services.