Formulas in Internal Spreadsheet just got a whole lot easier!
 Matthew O'Boyle / Mar 4, 2024
Exciting news for all Simul8 users: Our internal spreadsheets just got a major upgrade, making it easier and more powerful to use formulas in your simulations! Here’s how you can make the most of these new features to streamline your data analysis and enhance your simulation models.
Introducing the Formula Bar and Insert Function Button
No more scrolling through menus to find the right formula. Use the new formula bar and click the Insert Function button (ƒχ) to access all available formulas. This feature is a game-changer for speed and efficiency, making it straightforward to apply complex calculations without needing to memorize them.
Use Search and Filter for Quick Formula Access
Save time with the enhanced search and filter options in the formula library. Whether you’re calculating throughput times or analyzing resource utilization, finding and applying the right formula is now just a few clicks away.
Real-Time Calculations with Recalculate Formulas At Runtime
Keep your data analysis as dynamic as your simulations. With real-time formula recalculation, your spreadsheets can now automatically update during simulation runs. This means more accurate and timely insights into how changes in your model affect outcomes.
Define Names for Better Readability
Use the new Formula tab to define names for cell ranges. This not only makes your formulas easier to understand at a glance but also simplifies managing large and complex spreadsheets.
Experiment with Formulas for Deeper Insights
Push your analysis further by experimenting with different formulas to see how they impact your simulation outcomes. The ability to quickly apply and modify calculations enables you to explore various scenarios and optimize your models like never before.
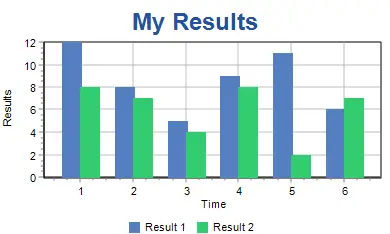
Effortlessly Customize Your Charts
Customer feedback is very important to us here at Simul8. You told us that the Chart Editor dialog used to create and edit charts on spreadsheets was not easy to use. We listened and have completely rebuilt brand new, super easy to use options.
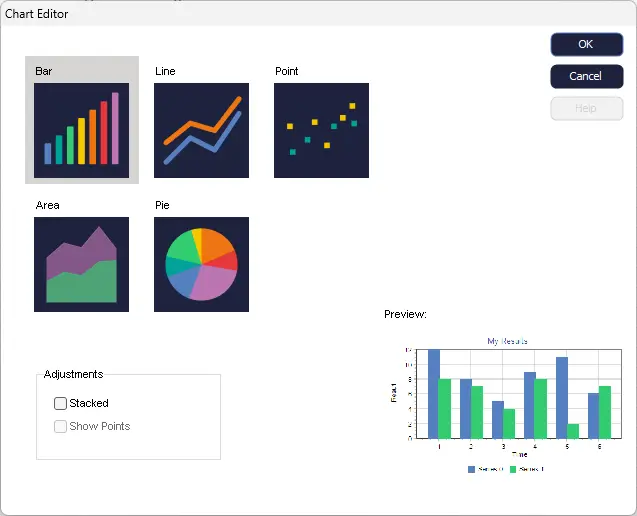
Transform your data into compelling visuals with the revamped Chart Editor. Selecting a chart now opens a new Chart Detail tab, where you can easily change chart types, adjust layouts, and edit data series. It’s all about making your results clearer and more persuasive to stakeholders.
By integrating these tips into your workflow, you’ll be able to harness the full potential of Simul8’s enhanced spreadsheet functionalities. Whether you’re a seasoned Simul8 pro or new to simulation, these updates are designed to make your simulation experience smoother, more intuitive, and ultimately more powerful.
Happy Simul8ing!
We hope you found this tip useful, and if you have any other applications/scenarios you’d like to see in our Simul8 Tips section, share them with us at support@simul8.com
About the author
Matthew O'Boyle
Matthew completed a BSc Mathematics degree and has built up a wealth of experience in banking, financial services consulting and project management. He is particularly interested in process improvement and driving efficiencies in an organisation’s procedures. This led Matthew to join Simul8 in March 2022 as a Customer Support Advocate where he now assists users who are using Simul8 to make data-based decisions in their own companies.