How to create a product mix in your simulation
 Sander / Oct 7, 2011
Most simulations will use different types of products/customers/patients that have their own unique characteristics. For example one product can be more expensive than the other or it can take longer to process product type A than product type B.
SIMUL8 offers a very easy way of modeling such a system and that’s by using and referencing spread sheets.
Over the next three weeks we will build up an example to illustrate how to simulate having different product types in your simulation and use these types to change process times and revenue generated by these products.
This week’s tip will show you how to set up different product types using a probability profile, week 2 will show you how to have different process times per product type and week 3 will illustrate how to apply unique revenue per product type.
This SIMUL8 tip will show you how to create a product mix in your simulation.
First, create the following structure:

If there is one thing I have learned over time it’s that there is no such thing as a standard product mix!
Each company will have a unique mix of products. In order to simulate that properly we will have to create that unique mix of products in our simulation. The way to do that is by creating a label that will hold a unique identifier for each of the products.
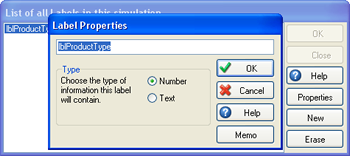
I highly recommend using a numeric coding scheme here because that will allow us to use the product type as a reference in our simulation (see next week’s tip). For example, if you have three product types (type A, B & C) code these as 1, 2 & 3. You can do this by creating a label. In this example I created a label called lblProductType. To create a label go to the Data & rules tab, click on Label and then New:

Since we will be using a numerical coding scheme select number in the “type of information” option.
Now we have created a label we need to assign a value to that label, but before we can do that we will need to create that unique order mix. The way to do that is by creating a custom distribution (data & rules tab, distributions) of type probability profile.

This type of distribution allows you to customize the split between different products according to the unique percentage that applies to your organization. In this example we are looking for the following split: 20% of type 1, 25% of type 2, 30% of type 3 and 25% of type 4. The easiest way to get this into the probability profile is to create and copy the following structure in Excel:

The first column will hold the percentage and the second column will hold the type. Now hit the paste button in the probability distribution window and you should see the following:

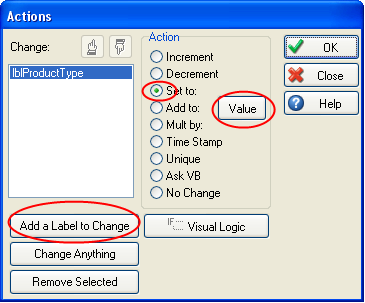
The last step is to assign these product types to your work items. The right place to do that is the Work entry point (WenP). Create a new action in your WenP by selecting your WenP and then click on Actions on the ribbon. Now add a label to change and select lblProductType, then click on set and a new window will appear.


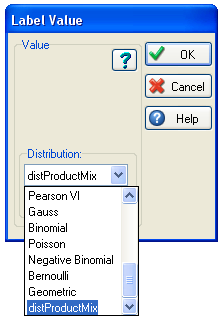
In this window change the distribution to the distribution we just created (all the way at the bottom of the list). This distribution will hold your product mix. When you confirm these changes your work items will now be assigned a value of 1,2,3 or 4 according to your own percentages.
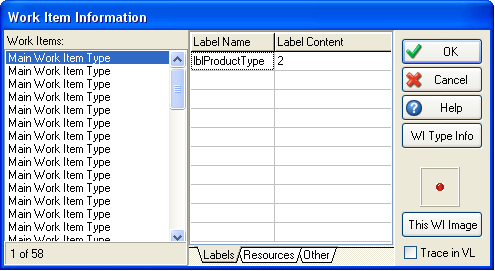
Let’s run the simulation for a while and inspect some of the values. Press Run and wait until the end of the run/until you have a number of work items in the storage bin. Now select the storage bin and click on the Advanced properties tab for that storage bin and click on contents. You should see the following window:

When you browse through the work items in the queue (left hand side of the window) you should see a change in the product types (in the right hand side of the window) according to the percentages applied in your distribution. You can add as many types as you want in this distribution as long as the total percentage adds up to 100%.
Next week we will apply a different operating time according to the product type.