Find Out How the Lead Time Chart Can Help Eliminate Waste
We’d like you to get to know our Value Stream Mapping feature so you can start quickly comparing lean approaches to find out which process has the best lean benefits. When we say lean benefits we mean namely Value-Added and Non-Value-Added, this is really important because as you may already know the key principles of Lean are:
- To remove Non-Value-Added steps and waste
- Focus on the customer
- Identify and understand how the work gets done – the value stream
- and manage, improve and smooth the process flow
In order to do the above it’s important to see where the bottlenecks are, and with the Lead Time Chart you can do exactly that!


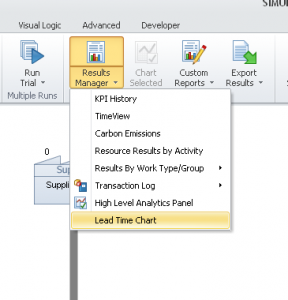
The Lead Time Chart feature is located in the Home tab under Results Manager. After running your simulation you’ll have the opportunity to identify how things can be improved in your process. You can also see how effective your process is at removing Non-Value-Added waste, and you will be able to accurately access your lean approach.

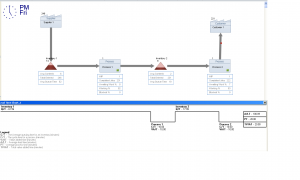
What’s really great about the Lead Time Chart is the ability to clearly see where your bottlenecks are. The dips in the chart represent the time the job spends in process steps. The raised segments represent time spent in inventory. The width of the segments represents the proportional amount of time the work spends in each stage. Obviously the longer the segment, the longer a work item spends at a stage in your process.
Compared to other Value Stream Map charts, SIMUL8 Lead Time Charts are unique because instead of being a static representation of the data captured in the Value Stream Map, they are live and dynamic. Instead of the inventory time being an estimated figure entered, SIMUL8 accurately predicts the average time working will spend in inventory and in the overall value stream to give a far more accurate estimation of lead time. This feature really allows you to understand the dynamics of your process so you can start eliminating waste.
We hope you found this tip useful and get to put it into practice soon! We’d also like to know how the Lead Time Chart helped you eliminate waste in your process so let us know.
Also, if you’re new to Value Stream Mapping and want to learn more, then head to our Help Files to read more about Value Stream Mapping with SIMUL8. If you’d like play around with this feature but don’t have SIMUL8 2012, no problem – try it out for free with our SIMUL8 Evaluation Edition.
If you have any suggestions for our next SIMUL8 Tip, get in touch.