One of the powerful benefits of simulation is being able to visually display the way your system is currently working and the implications of making changes to the system. One very common improvement our customers want to make is removing bottlenecks and line balancing.
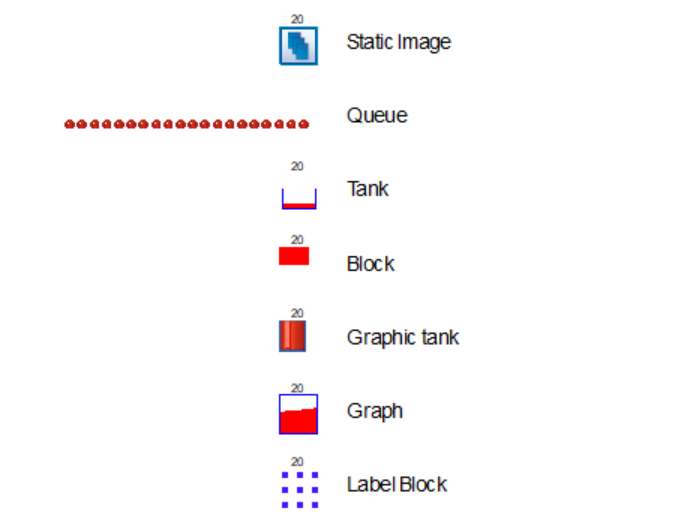
Animated queues are one of the most powerful ways to detect and visually show bottlenecks. We have many options for displaying a queue:
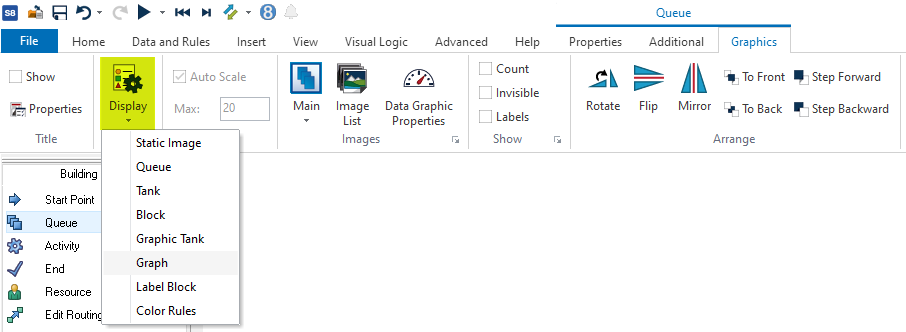
To access these options, drop a queue on screen, select its Graphics Tab and select the Display drop-down.
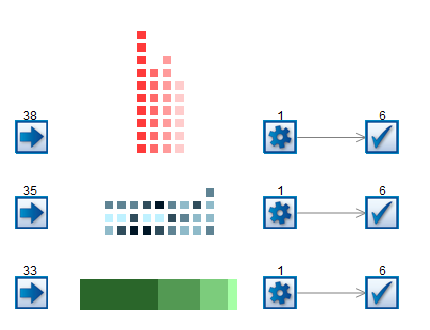
Let’s look at the Label Block option in more detail. This is a really powerful display option as it lets you see the size of the bottleneck and also the type of work causing it. It displays each work item’s specified label value at a glance.
In the Label Block options, you can choose a label whose value will dictate the color of the blocks. Enter the high and low values and choose the colors to represent these values. Any values in between will represent a gradient. You also have the choice to change the size of the blocks and the space between.
The blocks can be displayed as a bar chart, a standard block or a stack chart.
We have a helpfile with more information – https://www.simul8.com/support/help/doku.php?id=features:queue_visualization
Happy Simul8ing!
Do you have any applications/scenarios you’d like to see in our Simul8 Tips section? Share them with us at support@simul8.com
About the author

Matthew O'Boyle
Matthew completed a BSc Mathematics degree and has built up a wealth of experience in banking, financial services consulting and project management. He is particularly interested in process improvement and driving efficiencies in an organisation’s procedures. This led Matthew to join Simul8 in March 2022 as a Customer Support Advocate where he now assists users who are using Simul8 to make data-based decisions in their own companies.