Supercharge your simulations with live web data and R Connections
 Christoph Werner / Aug 2, 2021
How cool would it be if you could pull in live web data into your simulations to inform decisions based on things like current weather conditions or live traffic data? Well, great news – it’s all possible in Simul8 using our R Connection feature!
In this blog post, I’ll show you how to connect Simul8 with R and use ‘web scraping’ – gathering data from a website using code – to automatically include live data in your simulation.
Before I dive in with examples of scraping the web for live data directly from Simul8, let’s take quick recap on how Simul8 interacts with R.
A recap on Simul8’s R Connection feature
Setting up a connection to R in Simul8 allows you to call an R script automatically while your simulation runs or likewise before and after a run. Once you have set up your R Connection in Simul8, you can call your R code at the end of a simulation run, using the options in the R Connection dialog, or at any time using Visual Logic.
In some of my previous examples, I’ve shown how Simul8’s R integration feature allows for new and exciting visualizations of results. These examples include heatmaps for spatial results and treemaps for more in-depth group comparisons, such as production lines and their individual components.
So, with that quick recap, let’s find out how we use web scraping for live data and include it in a simulation!
Updating simulation inputs with live web data before and during runs
The possibilities of live data to use in your simulation are unlimited given that you can include data from (almost) any webpage!
Once you have selected the source for your data, you can use R packages, such as rvest, to extract any data from the webpage. This could either be numerical or also text data. With rvest, you can also point directly to specific parts of a the page you are interested in once you have briefly investigated the underlying HTML and CSS structure. Check out these handy tutorials to the package:
To help demonstrate how live data can be used to frequently update your simulation inputs, I’ll run through some simple proof-of-concept example simulations which you’ll be able to download and try out!
- Extracting current live temperature and precipitation data for a simple simulation each time before its run.
- Checking the local time in Boston via a webpage every time a Work Item in our simulation enters a specific Activity.
Example 1: Using live weather data for informing simulation decisions
Our first example simulation makes use of live weather data, current temperature and chance of rain to decide what Resource to select and then make a simple Routing decision.
For this example, I’m using live weather data from the Met Office. The screenshot below shows the data I want to use for decision-making in the simulation and where it is located on the webpage.
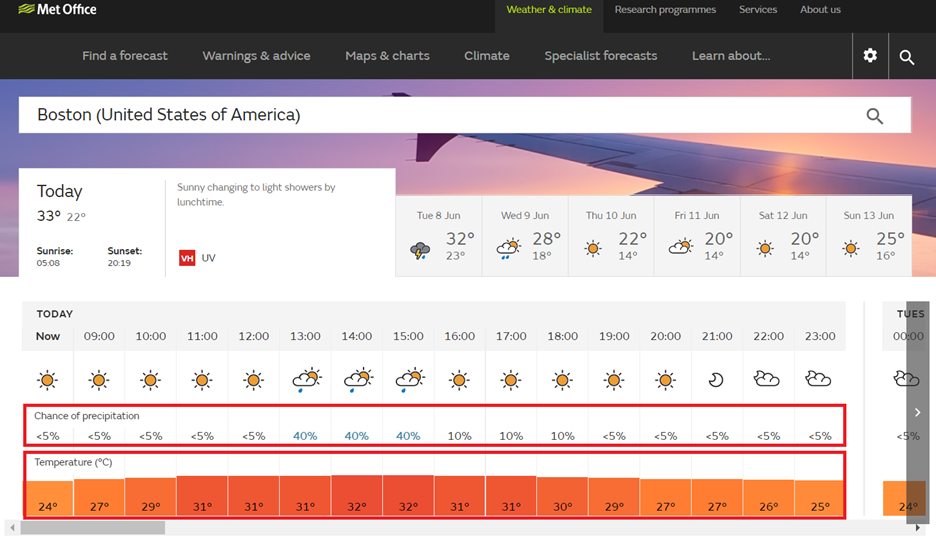
We are only looking at the precipitation % and temperature for the remainder of the same day (highlighted). Here, I’m accessing the webpage at 08:00 am, so we’ll consider each hourly timeslot until midnight that same day onwards.
When clicking the button to start running the example simulation, the following Visual Logic section connects to R via the command Run R Script to extract the above information and import it into two internal spreadsheets ‘ss_LiveWeatherPrecip’ and ‘ss_LiveWeatherTemp’ in Simul8. We will always clear the spreadsheets first, just in case the latest data covers less hours than the previous one and would not fully overwrite the previous data.

The R Script ‘R Script Live Weather’, which extracts the required data from the webpage, is built as follows:
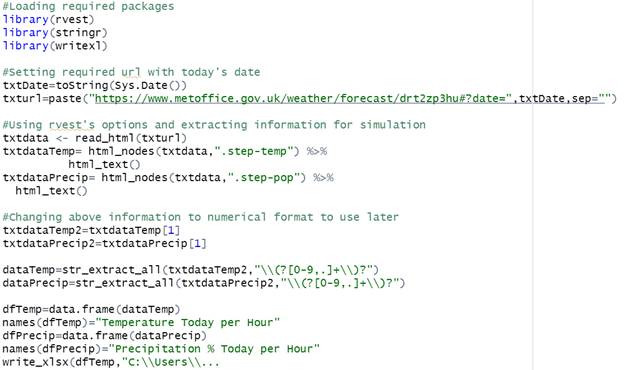
For the last step in R, the data is exported into an Excel spreadsheet so that we can use Simul8’s Excel Connections feature (calling it automatically using the Visual Logic command Import All Excel Connections shown above) to use the live data into the simulation. Here is how the corresponding spreadsheets for hourly temperature and chance of rain look after importing the data:
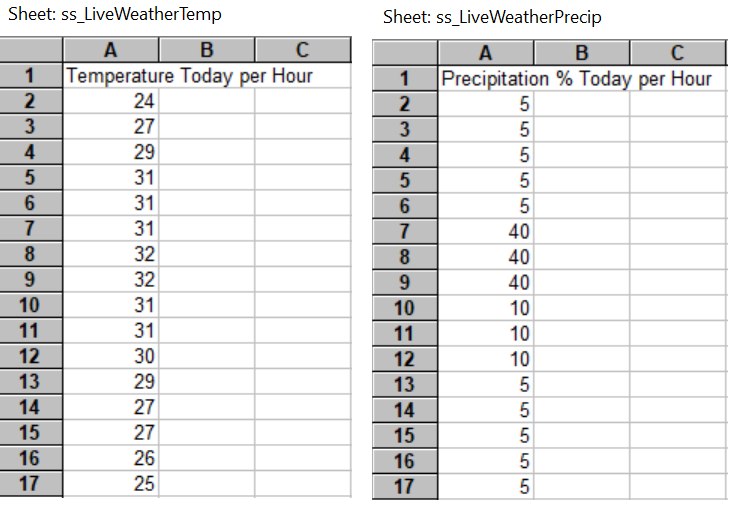
Each row corresponds to an hourly timeslot from the webpage. Based on these, we can then make the Resource and Routing decisions. Every time we click the Run button, the latest weather data will be imported and overwrite any previous temperature and precipitation information.
Finally, here is how our basic simulation looks in Simul8:
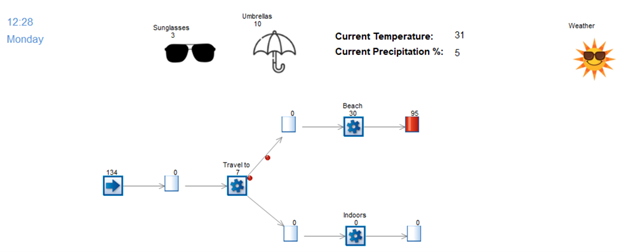
The starting time of the simulation is updated in accordance with the time we gathered from the webpage via our R Connection. For example, if the R Script is called at 8am, the simulation automatically updates its starting time to be the same and calculates how many hours are left in the day to run until midnight.
The exemplary decisions in the simulation based on the live data are as follows: First of all, if the precipitation percentage in a given hour is greater than 20%, the animated image of Activity ‘Weather’ changes to a rain cloud, otherwise a sun is displayed. Next, incoming Work Items will require the ‘Sunglasses’ Resource if the precipitation percentage in that hour is equal to or less than 20 %, otherwise the ‘Umbrella’ Resource is chosen. Lastly, if the temperature for that hour is greater than 18 degrees Celsius, Work Items go to Activity ‘Beach’ or otherwise they will route to ‘Indoors’.
Want to try out this example for yourself?
To run the example simulation, you will need to set up an R Connection and Excel Connection for the correct folder location on your own computer.
Example 2: Frequently checking the live local time in Boston during a simulation run
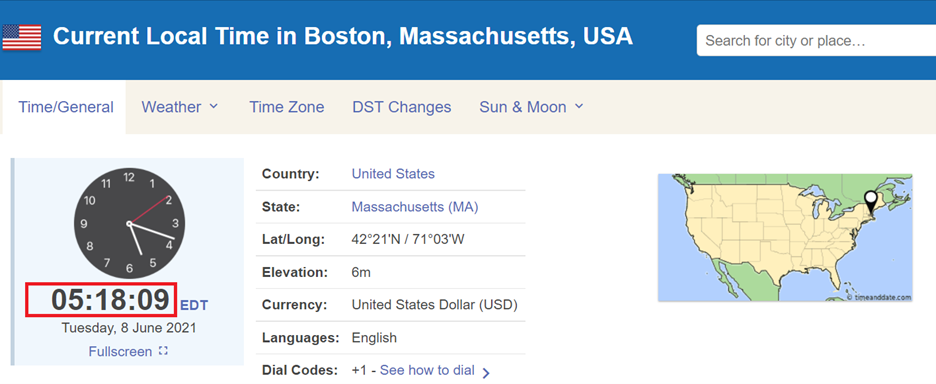
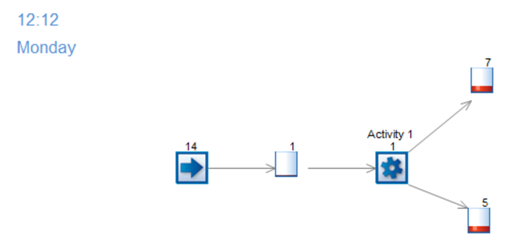
For our second example, we’ll extract live data from a webpage based on an action in the simulation. In this case, whenever a Work Item enters an Activity. Here, we’ll use the current local time in Boston that’s taken from live information on a webpage. We’ll take the current time’s sum (of hours, minutes and seconds) to make a simple routing decision by assigning a Label based on whether this sum is even or odd, then using that Label to route to a specific Activity.
We’ll take the current local time in Boston from TimeandDate.com and the live data we are interested in for our simulation is highlighted below:
The example simulation we’ll use looks like this:
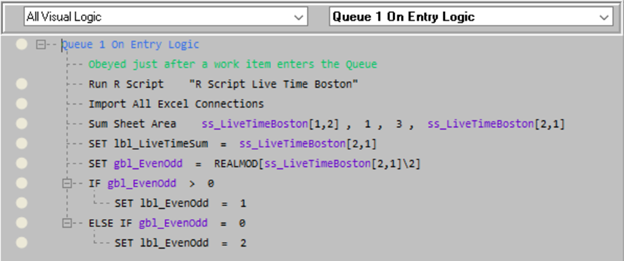
Every time a Work Item enters the first Queue, the following Visual Logic section automatically initiates Simul8’s R Connection and the R Script ‘R Script Live Time Boston’, similar to the one from our previous example, is run to extract the local time in Boston via our chosen webpage:
As before, R then exports this information to Excel which is imported back into our simulation automatically via the Visual Logic command Import All Excel Connections. The internal spreadsheet ‘ss_LiveTimeBoston’ looks like this:
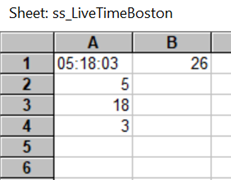
Here, we simply take the sum of hours, minutes and seconds and use Simul8’s REALMOD function to check if it is even or odd. Based on this, we assign each Work Item with a label which is used for Routing after Activity 1.
Although simple, this is another great example of how you can work with very frequently updated live data from the web. Ready to give it a try for yourself?
To run the example simulation, you will need to set up an R Connection and Excel Connection for the correct folder location on your own computer.
How could you use live web data in simulations?
So, what do you think, it’s a pretty cool feature isn’t it? I’m sure you’ll already have lots of great ideas of how you could implement other live data, like traffic data, current waiting times and more. The possibilities really are unlimited!
If you have any questions or examples you’d like to share with us, please reach out – we’d love to hear from you.