Memorial Health System, a leading healthcare organization based in Illinois, have used SIMUL8 to support more than 30 improvement projects since they began using the software in 2012.
Our recent blog post summarized four process steps that Memorial Health System use to guide simulation projects, deliver valuable insight for stakeholders and improve patient experiences.
- Knowing your inquiry – what questions we are attempting to answer?
- Knowing your process – what is the current and future process state?
- Knowing your space – what space is available and how will it be utilized?
- Knowing your data – what are our entry points, resources, constraints and results needed?
In this post, we’ll look at how these four steps helped the team to find a solution for minimizing traffic congestion at Memorial Health System’s $61 million 114-bed Patient Care Tower expansion.
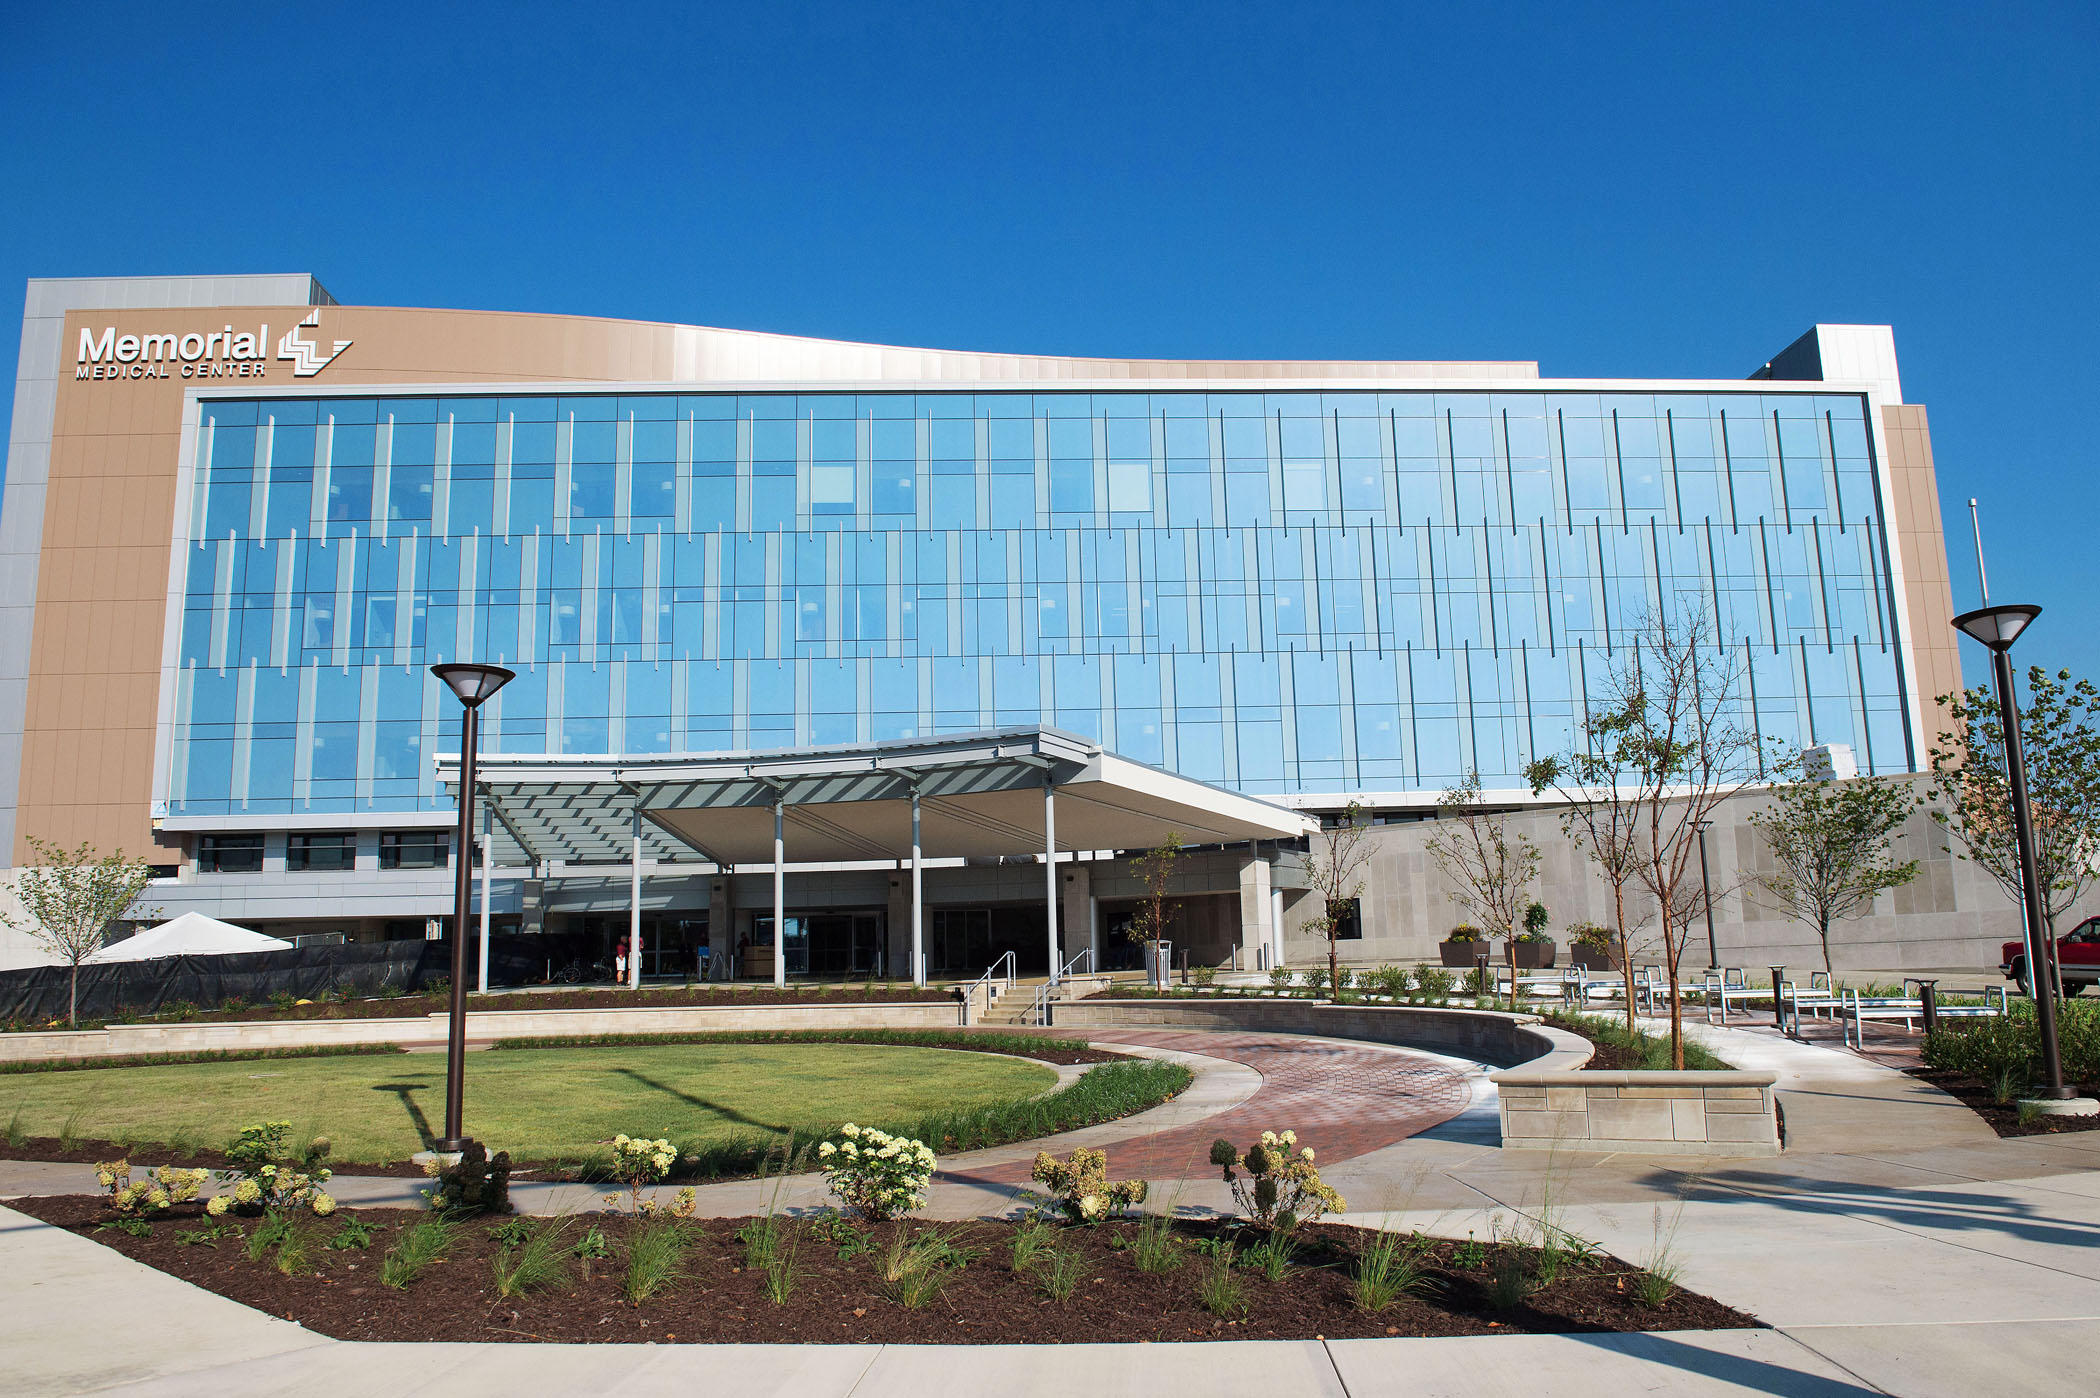
Memorial Health System’s Patient Care Tower front circle drive after construction
What were the considerations involved in the project?
Graham Prellwitz – Lean Six Sigma Project Manager, Memorial Health System
In November 2015, we opened a new 114-bed Patient Care Tower at our 500-bed flagship hospital in Springfield. As part of this expansion project, we had to plan a new front entrance and drive for access for patients, visitors and delivery people throughout the day.
Our inquiry was to look at the best way to set up our circle drive with current traffic volumes to avoid congestion and maintain safety for employees and patients being discharged.
This might seem like a fairly simple ask when you first look at it but as we looked at our process, we also had a complimentary valet service to consider, where visitors and patients are discharged and helped to their vehicles.
We wanted to avoid congestion or negatively impacting on the valet service, as well as overbuilding with too much space for cars to come in and out. Ultimately, we wanted to ensure that patients could be safely escorted and could cross the new circle drive while avoiding accidents.
When we looked to know our space, previous to construction we had two lanes for traffic throughput.
Lastly, we looked at our data. All we had to depend on were estimates from our valet staff. We knew how many vehicles we were parking, we had a rough estimate of how long it took to park them and where we were seeing vehicles from, but we were in a situation where we did not have a lot of data.
Lance Millburg – System Director, Decision Science, Memorial Health System
One of the goals for this project in terms of knowing our inquiry was about how we would present the data to our stakeholders and that the visual representation of it would be important. With SIMUL8, we could include a great deal of visuals and we could also build out an Excel front-end for our simulation as well. This meant that our stakeholders could manipulate the variables, run the simulation and see the results without having to have any previous experience of using SIMUL8.
In understanding our data, we had some level of observation data, so we knew that we were not going to be working with a lot of distributions. Normal distribution was not something that we had an opportunity to use with our data sets, but we understood that it would be more around time estimates, which was why we utilized Triangular and Uniform distributions in SIMUL8.
Through conversations with stakeholders, we were able to form a good, relatively accurate, distribution. We asked them “what would be the best-case scenario, the worst-case scenario, or the most likely?” If there is no most likely scenario then you will be using a Uniform distribution. If they give you three options, then you can begin to build from a Triangular perspective. That is how knowing our data in this situation, plus knowing that we had some challenges to our data set, helped to inform the types of distributions that we used.
How did simulation help find a solution?
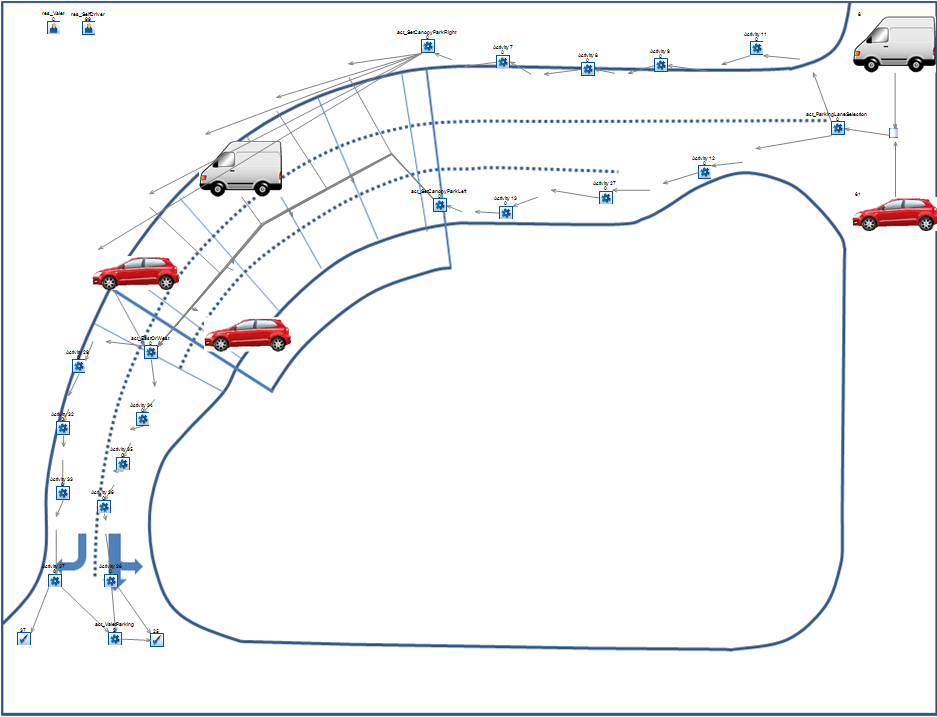
Through several iterations of the simulation, we arrived at a solution of using a middle lane purely for vehicles to flow through.
We recognized that we wanted to keep the lane closest to the hospital as open as possible, so this would only be used for patients that were going to be parking for five minutes or less, which is the operational guidelines that the valets are working under.
If it is going to be a longer stay and valets need to go and get the patient, or they need to have a conversation with the provider that might take more than five minutes, the outer lane would be used.
Finally, we knew that another objective was to to prevent traffic from backing up onto the main road, which is First Street in Springfield. Using the simulation, we were also able to identify the best way to route traffic leaving the drive.
Our traffic laws allow for turning right on red or to turn right out of a right-turn lane in many circumstances. We wanted to know whether to put that straight to go across traffic in the right-hand lane or the left-hand lane. Using SIMUL8, we were able to simulate down to that level of detail based on observation data and conversations with our subject-matter experts.
The simulation showed that using a straight-right combination would lead to more backing up of traffic. Based on the simulation results, we decided that it made a lot more sense for us to have the left-straight combination out of the circle drive.
In addition to patient traffic, we also knew that we had commercial traffic to consider, such as flower, food or equipment delivery couriers. To help further improve throughput, we decided to move as much of that routine delivery to a different entrance of the hospital to ensure that we left as much space as possible for our patients and for visitors to be able to use the main lobby of the hospital.
Another benefit of using the simulation from a visual perspective is that SIMUL8 allowed us to change icons based on distribution, so the trucks shown in the simulation are a truck variable and the cars are a passenger variable. We could change the distribution of commercial traffic versus patient traffic and see how that would impact it, not only from a numbers perspective but also visually. This was really helpful in giving multiple ways of interpreting the information for our stakeholders and highlighting the types of traffic that were building up.
What other challenges has simulation helped solve?
In our next blog post, we’ll look at how Memorial Health System’s four considerations were also applied to identify how to rebuild a portion of a small critical-access hospital to centralize five different testing areas.
In the meantime, take a look at our case study to learn how simulation was used to ensure the feasibility of a $31 million OR expansion and improve emergency department patient flow.
Learn more about using SIMUL8 to design efficient healthcare facilities
Simulation allows you to design a space that is exactly what you need for your processes and patient volumes using organization-specific information.