In Kanban systems, identifying where bottlenecks are blocking consistent flow is key to faster and more reliable delivery. This is exactly why many of our customers use simulation – to help understand how work is flowing through their system.
As simulation provides a high-level, visual representation of a system in action, it allows you to very quickly identify problems and find solutions to ensure work flows consistently.
Queues, places where work to be completed will wait for Resources or Activities to become available, are an important element to consider when optimizing the consistent flow of a process.
SIMUL8 enables you to easily highlight the status of Queues, showing where they’re starving the process or creating bottlenecks in your system. Using the conditional queue graphics feature, Queues will dynamically change color as the simulation is running, based on the conditions and restrictions you have applied.
As well as SIMUL8’s own extensive library of queue graphics, you can also use custom graphic queue indicators to add a further layer of customization to your simulation.
Using Display+
If you want to go further and do something completely customized, Display+ is a group of Visual Logic commands that enables total control over the visual display of your simulation. You can customize image changes to be event or time driven – for example, you could have text appear whenever a shift change occurs or draw a graph of your results as the simulation is running.
In this SIMUL8 tip, we’ll show you how to use Display+ to show a customized Queue status image depending if the number of work items in a queue are above or below a certain value.
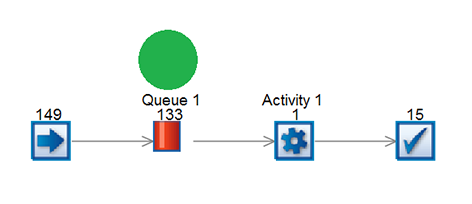
In our example simulation, we’ll display circle indicators but you can use any shape or image you’d like. We’ll use a green circle to indicate a ‘safe’ level of parts and a red circle to show when the level of the Queue is less than 100.
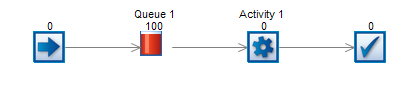
We’ll start by creating a simple example simulation with a Start Point, a Queue, an Activity and an End Point:
Whenever a work item enters Queue 1, we want to check to see if this will change the level of the Queue to a ‘safe’ level. If it does, a green circle will be displayed.
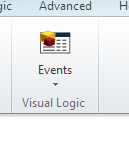
To do this, we can trigger Visual Logic by selecting ‘Queue 1’, clicking on the ‘Additional’ tab, and selecting the Visual Logic button:
Select the ‘On Entry’ section, so that the simulation will trigger this whenever a work item enters the Queue, and enter the Visual Logic:
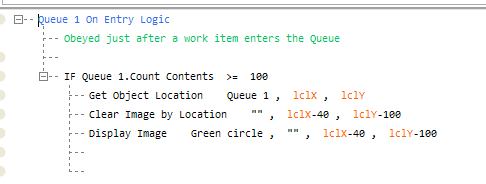
The ‘IF’ statement is used to check the contents of the Queue – so whenever the value is greater than 100, the simulation will execute the remaining Visual Logic. You’ll also notice that we’ve used the ‘Get Object Location’ command here. This returns the location of the object (‘Queue 1’ in this example) and stores the X and Y coordinates in the two local variables ‘lclX’ and ‘lclY’. By using the ‘Get Object Location’ command, we don’t have to worry about what happens if we move the Queue – this code is generic and will work wherever the queue is placed.
Before displaying the image, we’ll remove any other images which may be displayed by using the ‘Clear Image by Location’ command.
Once the coordinates of ‘Queue 1’ are returned, we use these, along with offsets of -40 pixels and -100 pixels, to show where the green circle (or your custom image) should be displayed.
Lastly, we need to create code that will be triggered whenever a work item leaves the Queue. We’ll repeat the same Visual Logic steps above, but instead of ‘On Entry’, we select ‘On Exit’. Using the code below, when a work item leaves the Queue, the simulation will check to see if the value is less than 100. If it is, a red circle will be displayed.
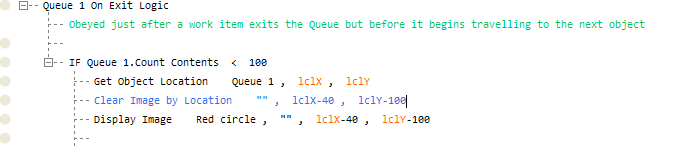
Again, we use the ‘Get Object Location’ command to identify where the image should be displayed. You’ll notice that the offsets of -40 and -100 are the same as in the code for the ‘On Entry’ portion. Whichever offsets you chose, you need to ensure that they are the same in both sections (so that the simulation doesn’t delete an image that’s in the wrong location).
In this example, we have used the level of 100 work items as the trigger, but you can change this in both sections of code to any relevant value.
Using SIMUL8’s range of queue graphic options, you’ll be able to really engage stakeholders with a visual, easy-to-understand representation of how work is flowing through the system.
Get more SIMUL8 tips
If you’re a SIMUL8 user, visit our Support Portal for more resources and technical insight.