Meeting the challenge of planning for frailty with simulation
 Tom Stephenson / Jan 18, 2018
Health systems worldwide are facing a range of challenges as a result of ageing populations. One key challenge associated with these changing demographics is ensuring healthcare services and processes are in place for people with frailty – those at the highest risk of falls, disability, admission to hospital, or a need for long-term care.
Frailty is identified by a number of symptoms such as weight loss, muscle loss and weakness, fatigue, slow walking speed and low levels of physical activity.
By improving planning for those with frailty, health systems can ensure that the right interventions are put in place to support people living with the condition, help them stay well for longer and reduce hospitalization costs.
In this blog post, we’ll examine how simulation is helping health systems to plan and manage frailty from three different perspectives:
- The demand question: How many people with frailty will we need to support in the future?
- The new model of care question: What is the impact of introducing new models of care to support those with frailty?
- The discharge question: If people with frailty are hospitalized, what resource will we need to ensure appropriate discharge services once they are medically fit?
Simulation enables health systems to test these questions to a high degree of detail, identify potential solutions and generate evidence to support decision-making.
Download the ebook
Learn the benefits of using simulation to plan and manage frailty care services – download the ‘Meeting the challenge of planning for frailty‘ ebook.
Identifying future demand
According to the World Health Organization, between 2015 and 2050, the proportion of the world’s population over 60 years old will nearly double from 12% to 22%. As the chance of having frailty increases with age, health systems are becoming increasingly focused on ensuring that their health and social systems are prepared for this demographic shift.
In the UK, 5% of people aged 60-69 have frailty, with this figure rising to 65% in people aged over 90. The UK NHS define frailty as mild, moderate or severe and primary care physicians are applying tools like the electronic Frailty Index (eFI), developed by Leeds University, to identify and grade severity to improve management of patients.
The eFI was tested using data from around one million UK patients aged 65-95 in two large research databases (ResearchOne and THIN). It was found that 50% of those patients were fit, 35% had mild frailty, 12% had moderate frailty and 3% had severe frailty.

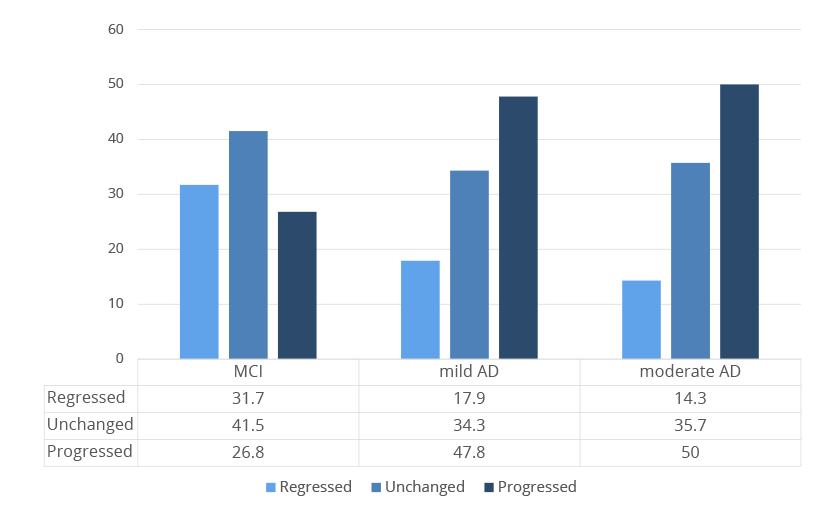
(MCI, mild and moderate AD) – Chong et al. BMC Geriatrics (2015) 15:175
Health systems planning service capacity for people with frailty need to take into account a range of factors including:
- The age of the population and demographic change over time
- The proportion of over 65s with frailty by severity
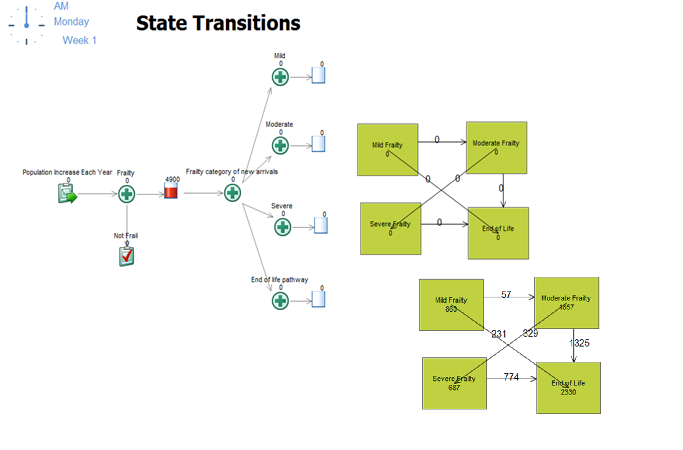
- The likely transitions between frailty states each year
- The likely deaths in each group
Research data can be used to provide the probabilities to project demand e.g. people likely to have severe frailty in the next 5 years. State transition modeling can manage these calculations but the results can be counter-intuitive as it’s possible for people to move between frailty states with studies demonstrating that they can both regress as well as progress.
Simulation modeling techniques are able to handle these dynamically changing progressions, providing more accurate results for planning the numbers of patients expected to need services.

Planning new models of care
Once people with frailty are identified, appropriate support services need to be made available to them. It is usually recommended that frailty assessments are initially undertaken such as falls risk assessment, medicines optimization and cognitive assessment, with the aim of planning care to focus on “personal goals and the available support required to achieve them”. (NHS England)
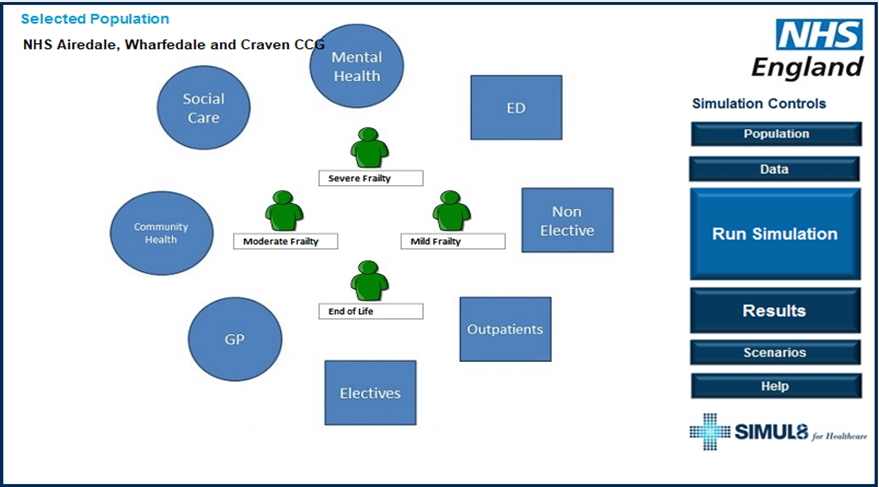
Simulation can be used to build process flows representing the typical pathways of care for patients at mild, moderate and severe states of frailty. A “baseline” simulation can then be used to help understand how patients are currently using services, showing the flow of patients through a service with a final point where outcomes and KPIs are measured.
In a simulation of patients with frailty, unfortunately the only end point is end of life as these patients need access to ongoing, continued support. In the example below, you can see that we can simulate the care pathway as a set of services around the patient with probability distributions representing the likelihood of individual patients accessing a service e.g. hospital admission, community health service and their frequency of visits.

Associating cost and capacity with each of these services allows results to be generated which can be validated with existing data and stakeholder insight. These demonstrate the real life context in terms of:
- Activity by services
- Cost per patient, by acuity
- Cost to the system and to each service
- Capacity required to deliver services to patients
From this baseline simulation, “what if?” scenarios can then be tested to aid decision-making:
- What is the impact of assessing all patients with moderate and severe frailty?
- What additional services are they likely to be referred on to (e.g. falls clinic, medicines management service, health and wellbeing worker) and what capacity will be required to deliver the service?
- What is the likelihood of reduction in hospitalization, mortality as a result of the intervention?
- Do the costs of the new service equal the reduction in hospital costs or is the service saving money?
- How will the system cope as the population ages?
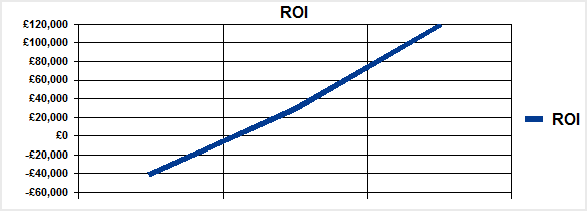
The simulation allows comparison of results between the new model of care and the current state, showing the business case for change and the expected return on investment.

Ensuring discharge services are available
If patients with frailty become hospitalized, there is good evidence that their length of stay is often longer than medically necessary because of the need to ensure additional support when they leave hospital.
Some hospitals are developing frailty units so that when patients with frailty come into hospital as an emergency, they are admitted to a short stay rehabilitation environment which increases their likelihood of early discharge.
Health systems need to be able to identify the resources that are required to enable discharges at the right time. Patients need to be assessed and have services in place on the day of discharge, otherwise they will spend additional unnecessary days in hospital. How much resource is needed and does the cost of that resource increase or reduce the overall cost?
Simulation allows you to test resource scenarios and identify when staff and equipment need to be available for a discharge to take place, as well as the impact on hospital bed occupancy if capacity is unavailable when it is needed. By running different scenarios, you can find an optimum solution through careful balance.
Contact us to learn more
Simulation can help to overcome the complexity of planning services for people with frailty and provide accurate evidence for change. If you would like to learn more about using simulation to assess options for change, get in touch with our team.