Friday’s Tip- Looking at Work in Progress Results
As you may already know, developing a simulation in SIMUL8 is really easy. To get started you simply need to drag your four items onto the screen, which are; your work entry point, storage bin, work center and your work exit point.

Once your objects are on the screen run and you’ve run your simulation to the end it’s now time to look at some of the results.
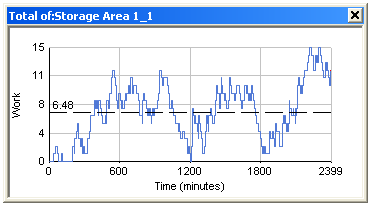
Work in progress is often an important result in a simulation as it allows you to see peaks and troughs in terms of demand in your process. Knowing this can help you understand at what points your system is going to be at maximum capacity and consider if there is anything you need to change as a result of this.
If you need to look at your work in progress there are several ways to do this in SIMUL8. Once you’ve finished running your simulation click on your Storage Bin, then on the ‘Home’ tab and then on ‘Chart Selected’.

A Chart will appear on your screen which shows you a graph of work in progress throughout the simulation run.

Alternatively you could put this graph on screen before running your simulation and then you can watch the graph update dynamically as the simulation runs.
This shows you at a high level how your work in progress looks throughout your process, however if you would like some more detail, your simulation can show you that too!
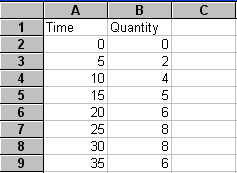
Right click on the chart and select the option ‘copy data to clipboard’, then on the ‘Data and Rules Tab’ select the spread sheet option.

Once in the spreadsheet select the paste icon on the right hand side and a list of all you Work in Progress data will appear in the spreadsheet.

As well as being able to copy this data to a SIMUL8 internal spreadsheet you can also export it to Excel.
This is a really easy way to begin to understand your Work in Progress in detail. Of course, in most simulations you would like to know more than the work in progress of just one object.
So to make this easy, all you have to do is select multiple objects and hit the chart button, and now you will be able to see the total work in progress for all the objects selected combined!
What results are important in your simulation? Let us know and we can feature it in a future Friday Tip.