Setting up a Probability Profile in Excel and moving the data into the simulation
In this SIMUL8 Tip, we will look at setting up a Probability Profile in Excel and moving the data into our simulation.
For this example, we may be modelling a hospital which can have 15 different types of patient, each of which make up a percentage of all patient visits.
First, we need to create a Probability Profile within our simulation. We’ll call this “dist_Example”. When we create this, by default, we will see the below columns:
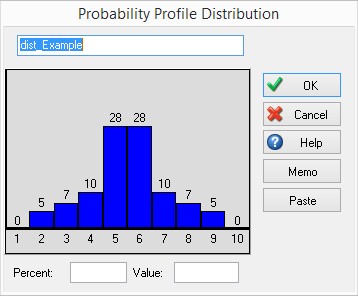
We can obviously manually add or remove columns and alter the values sampled for each column, until we have the 15 patient types and their percentage of total patients. However, this can become time-consuming, if we have a high number of columns.
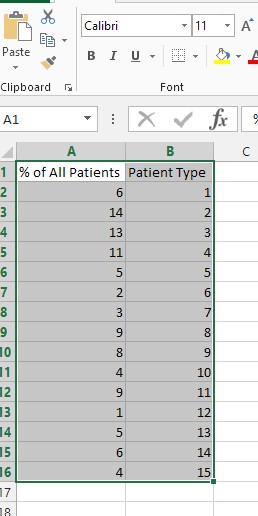
Alternatively, we can set up our Probability Profile in Excel and paste this into our simulation. First, we need to populate our data. This may be taken from existing data, but we will manually enter the data to Excel, in this example. We set up the below columns in Excel. The percentage must be in the first column, with the value sampled being in the second:
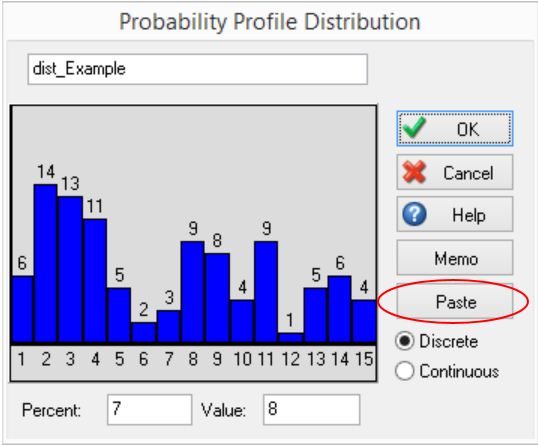
We then highlight our data in Excel and copy using Ctrl+C. Next, on the Probability Profile window of “dist_Example”, we click the Paste button. This automatically updates the Probability Profile to reflect our values from Excel.