Written by Liam Hastie on Friday September 20th 2013 in Simul8 Tips, Technical Corner
SIMUL8 Tip: Quick Charts – use results the fast way!
SIMUL8 offers lots of different ways of collecting and visualizing results. Quick charts are the fastest way of getting visual results in SIMUL8 and are a great way of instantly adding something exciting to your simulation.
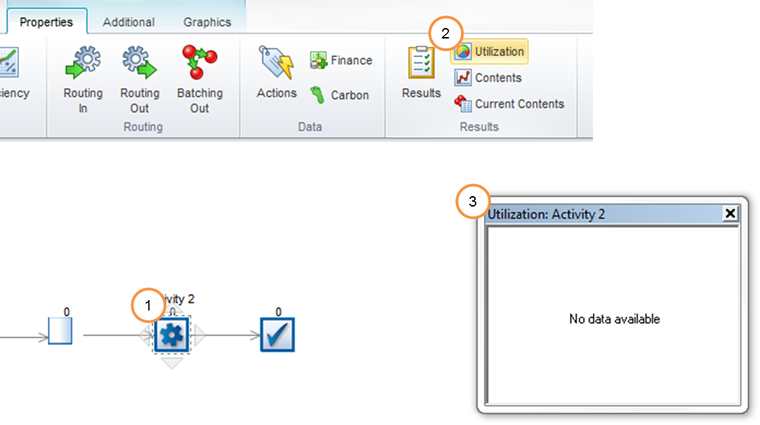
To add a quick chart:
1.Left-click to select an activity or a queue.
2.In the properties tab select any of the charts to the right of ‘Results’. I have chosen to create a utilization chart.
3.The chart will appear on screen (here it is blank as the simulation is reset to the starting time).
4.Move the chart around by dragging on the blue bar at the top of the chart window.
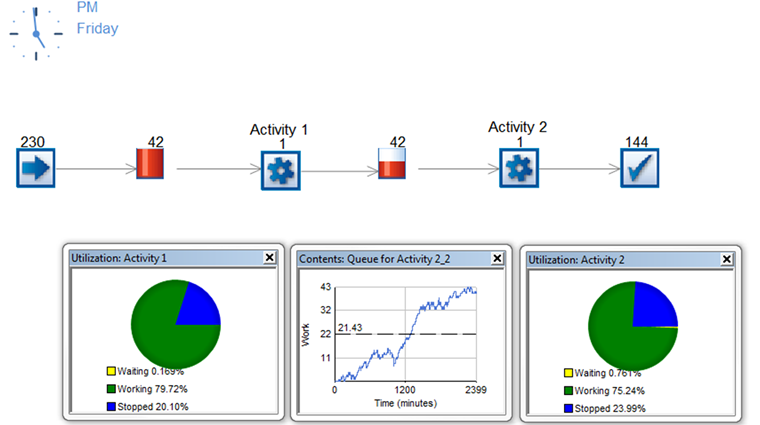
Using Quick charts:
Quick charts from multiple objects can be displayed at the same time and they will all be updated as the simulation runs. Creating sets of dynamic visual results like this helps you to see how a process behaves over time and will make your simulations much more engaging during presentations.