In this feature spotlight, we take a closer look at the Distribution Viewer, an intuitive new SIMUL8 feature for defining, creating and visualizing Named Distributions.
Many SIMUL8 users use Named Distributions to define timings like inter-arrival times, activity timings or repair times in their simulations. The new Distribution Viewer feature makes it even easier to define a distribution. At a glance, you and your stakeholders will be able to see how the distribution looks and how timings will vary.
Using the Distribution Viewer
As before, you can create a new Named Distribution from the ‘Data and Rules’ tab in the ribbon by selecting the ‘Create Distribution’ drop-down button and choosing the ‘Named Distribution’ option from the dialog.
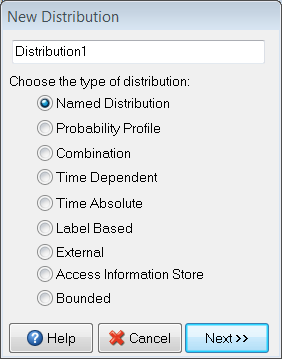
You will then see the Named Distribution dialog, shown in the screenshot below.

At the top of the menu you can name your distribution. By default, it will be called ‘Distribution 1’ for the first distribution created, ‘Distribution 2’ for the second, and so on.
On the left hand panel, you can choose the parametric form of the distribution and its parameters. In the screenshot above, you can see a visualization of a Normal Distribution. You can update each of the parameters and the visualization will automatically update. You can also include a fixed offset value if required.
The minimum and maximum values are displayed on the x-axis, showing the range of vales you can expect from the distribution. The blue bars represent how often a value is likely to be sampled. The higher the bar, the more likely this value will be sampled from the distribution.
Once you are happy with the distribution, click OK to save. Your distribution can then be used anywhere the Formula Editor can be accessed.
Randomize and sampling
By clicking ‘Display’ on the right of the Named Distribution dialog, an additional sub-menu is shown. Here, you can sample from the distribution, up to one million times, to generate a data-set that is used to draw the histogram in the Distribution Viewer.
By increasing the number of samples, you will get a clearer idea of the most likely sampled values and the possible extreme values of your chosen distribution.
You can also choose whether you want to change the random stream each time you refresh the histogram. Leaving the ‘Randomize’ box unchecked will set the stream to be the primary seed value (the same seed which is locked when you first open SIMUL8). Checking the box will change the seed value each time the ‘Refresh Histogram’ button is pressed.
Learn more about SIMUL8 2020
This new feature, along with other additions including enhanced Database Connections and Process Mining integrations, are now available for all new license purchases of SIMUL8 Basic, Professional or Team. SIMUL8 Annual Maintenance customers have already received an email invitation giving them first access to SIMUL8 2020.
Learn more about SIMUL8 2020 or contact our team for more information.