In this spotlight feature, we take a look at SIMUL8 Professional 2019’s added ability to connect directly to R – opening up a whole new way to analyze and visualize your simulation results!
SIMUL8 users have the ability to export their results to many other programs and applications to help them conduct further analysis or present their results to stakeholders in different ways. Driven by feedback from our users, we are adding another option to this list with the ability to connect to R. Using this powerful feature, you can easily export your simulation results directly to R and even run R scripts within SIMUL8 Professional!
What is R?
In a nutshell, R is an open-source statistical programming language and software environment that is used for a wide range of data analysis and visualization applications. It has risen in popularity over recent years, especially among statisticians, data analysts, data scientists and similar professions. As many of these professionals use simulation as part of their technology stack, it’s no surprise that we had many requests from our users to combine the power of SIMUL8 and R for even deeper analysis of simulation results. If you are not familiar with R, but are still curious about this new integration, take a look at a general introduction to R and an overview of popular R visualizations and graphics.
Given the huge range of potential applications for using R with SIMUL8 results, we can’t give an overview on all of these in just one blog post. For now, we’ll start out by showing how to set up the connection between R to SIMUL8 and how to quickly start visualizing simulation results in new and useful ways. Watch this space for more tips on using SIMUL8 and R in the coming weeks and months!
Before we get started, you will need to have both SIMUL8 Professional 2019 and R installed on your device. You will also need to store the simulation results of your choice in an internal spreadsheet in SIMUL8.
Setting up the SIMUL8 Professional connection to R
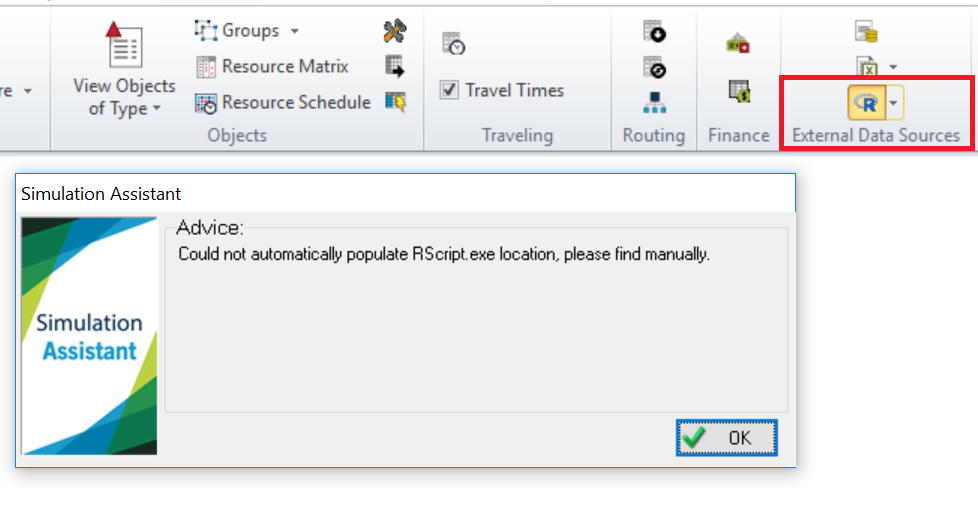
Exporting results directly to R and running R scripts from SIMUL8 is simple. First, go into the Data & Rules tab in SIMUL8 Professional. In the External Data Source section on the top ribbon, click the “R Scripts” button (just below the “Excel Connections” option).
If you already have R installed in your Program Files, SIMUL8 will automatically detect the RScript.exe. In that case, you are ready to choose the specific R script that the simulation results should be exported to (see next step on how to choose your R script).
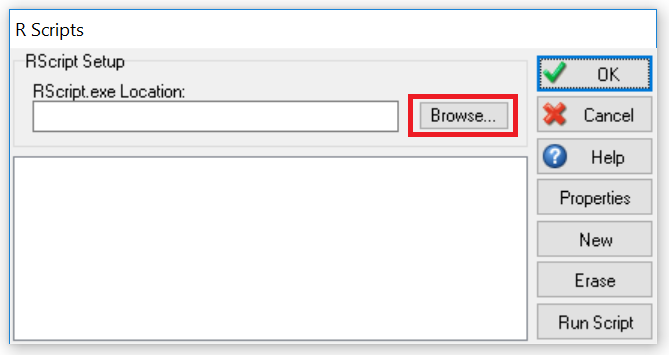
If SIMUL8 can’t detect the RScript.exe file automatically, you will see a dialog prompting you to set up the connection manually. To do this, just click “OK” on the dialog and the window to set up a connection will display. In this dialog, click “Browse” (see screenshot) and point to the location where R has been installed on your device. Once you have found the location, select Rscript.exe and you will have now set up SIMUL8’s connection to R!
Setting up the Script Properties and selecting an R script to use
Once the connection to R has been set up, you need to choose the specific R script file that you want to run and export your simulation results to. In the dialog “R Scripts”, click the “New” button. In the “R Script Properties” dialog, give this new connection a name. Choosing a recognizable name will make it easier to identify a specific connection if you set several up.
Click the “Browse” button in the dialog to browse the location of your R script file and select it. Then, choose a run setting. For example, choose “End of Run” if your simulation results should be exported to R at the end of a run, “End of Trial” if it should be done at the end of the trial or “None” if you don’t want to set up an automatic connection yet or you want to set this up through Visual Logic (see the next section for more details).
Lastly, choose the internal spreadsheet where the simulation results to be used by R are located. This is a standard internal spreadsheet that many SIMUL8 users will have already used before. When you want to produce Box Plots of selected KPIs from trial runs (see last section below), leave this box unchecked.

Exporting data to R and running the R Script from SIMUL8
With the connection from SIMUL8 to R now set up, you can choose between various ways for exporting the data and running your R script.
The first option is to do this automatically which you might have already set up in the previous step. That is, when you choose “End of Run” or “End of Trial” in the Script Properties menu.
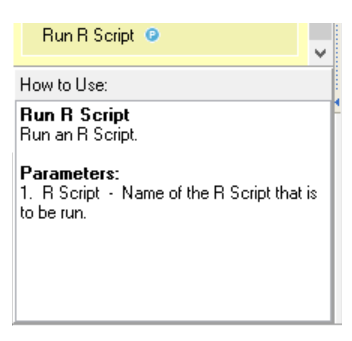
Another option is to run your R script using Visual Logic. The Visual Logic command shown in the screenshot below can be used to do this. The only parameter needed is the name of the R script you are using.
Lastly, you can run the R script by clicking the corresponding button in the R Script menu (where you chose the location of your script). Note, here you can also delete any scripts which are no longer needed or amend their properties.
Using built-in Trial Run Box Plots in R without an Rscript
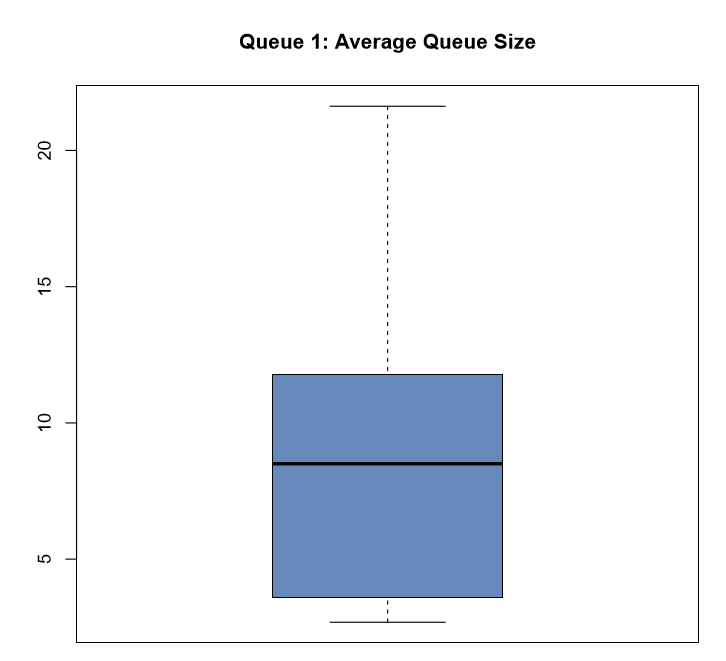
If you have no experience with R but still want to benefit from this new feature, you can try the built-in Box Plot template to easily visually summarize trial run results. You can see an example of how this looks below.
The box plots considers the results of all trial runs for the chosen KPI and it can be chosen by right-clicking on the KPI in the Results Manager (Data & Rules tab) and selecting “Display as Box Plot using R”.
An exciting new way to analyze and visualize simulation results
As you can see, R integration offers another powerful and flexible approach for analyzing your SIMUL8 results. This helpful feature will enable you to easily export the results of your simulation runs and trials direct to R, reducing the steps to start analyzing your data using this popular open source statistics and data mining tool.
Keep an eye on our blog for more great tips on using R with SIMUL8 in the coming few weeks!
We can’t wait to see how our users take advantage of this exciting new feature! R integration is just one of the powerful new features available in SIMUL8 2019. Find out more about our latest release and get in touch with our team for more information or to give us your feedback.