Disease modeling for COVID-19 simulations – a hybrid simulation tutorial
 Christoph Werner / Apr 28, 2020
If you’re building simulations to help in the fight against COVID-19 – for example, to help assess how hospitals will cope with changing demand for ICU beds and ventilators or to plan effective drive-through testing sites – you might wish to incorporate elements like the impact of changes in infection rates or changes in patient’s conditions to enhance your results.
In SIMUL8, we can do this by combining elements of both discrete event and agent-based simulation in a hybrid simulation. If you’re not familar with the different methods of simulation, you can learn more about them on our website.
In this tutorial, I’ll show you how to use SIMUL8’s State Charts feature to capture the dynamics of a disease as an input into a discrete event simulation. We’ll look at two examples, one using population infection rates to set arrivals into a clinical process and another to incorporate the impact of how deteriorating health on patient flow through a treatment process.
What are State Charts?
In traditional discrete event simulations, Work Items (in this example, patients) are pulled through the process by the activities or steps involved in the process. By using State Charts, the Work Items (or agents, as they are sometimes known) can control or alter the process or change state based on a set of defined conditions. By incorporating State Charts into simulations, you can understand how the behavior or interactions of these individual agents will impact the performance of the overall process or system.
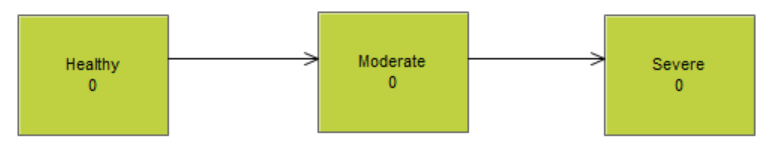
States describe the various conditions through which the disease can progress. For example, ‘healthy’, ‘moderate’ and ‘severe’ stages of a disease.
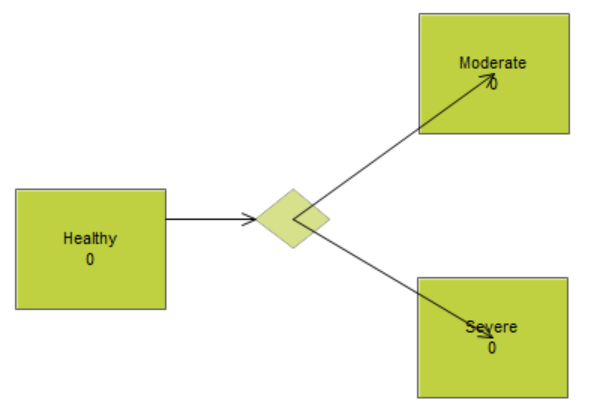
We can also add decision points between States which are used to transition patients to the next State. For example, a patient could fall ill but rather than following a linear process of going through a moderate illness before becoming severe, they might directly become severely ill. In the case of COVID-19 patients, this might happen where a patient has an underlying health condition or they belong to a more vulnerable age group.
How can you use State Charts for COVID-19 simulations?
State Charts can be used together with discrete event simulations in many ways. In this tutorial, I’ll introduce two common applications that will be useful for COVID-19 simulation modeling.
Case 1: State Charts for determining numbers of patients arriving at a clinic
In our first example, we’ll use State Charts to determine the number of patients being admitted to a hospital or visiting a doctor, depending on the disease’s progression over time.
Here, we have two separate simulations: one using a discrete event approach and the other using State Charts.

The discrete event simulation, at the bottom of the screenshot above, represents the arrival into a clinic and the initial process that patients go through. We have used a relatively simple process here, but you could add any other necessary details of the clinical process you want to model.
The State Chart simulation, at the top of the screenshot, represents the development of a disease through the number of infected people in a population, either with minor or major symptoms. We will assume that only people with major symptoms need to be admitted to the hospital or doctor clinic, as modeled in the discrete event simulation.
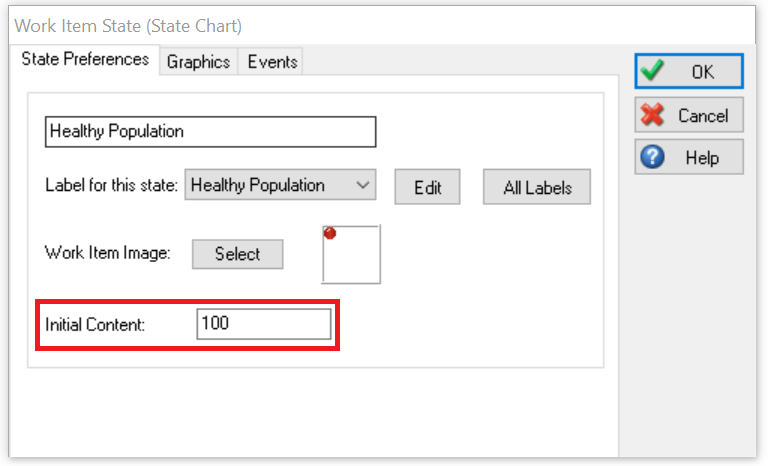
In the State Charts, we first set how many people are part of our initial healthy population. For example, this could be the population of the region that a specific hospital or doctor clinic serves.
In this simplified example, we assume an initial population of 100 healthy people. To do this, change the ‘Initial Content’ window on the top ribbon or double-click on the State ‘Healthy Population’ to the dialog below.
Next, we want to determine how the number of people in each State changes per time unit. First, we make sure the different States are connected in the correct direction. On the top ribbon, choose the ‘Transition Out Of State’ option.

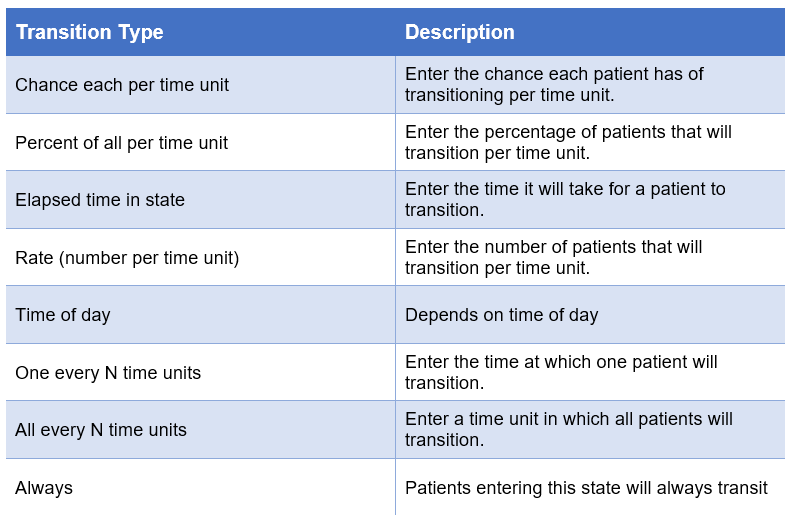
In this case, we assume there is a 0.5% chance to transition from ‘Healthy’ to having a ‘Minor Illness’ (or minor symptoms) each time unit, i.e. each minute. The same set up can be applied for all other transitions, such as ‘Healthy’ to ‘Major Illness’ and ‘Minor Illness’ to ‘Major Illness’. As well as time units, the State Charts feature also allows you to set up other transition types.
Now that we have defined how the disease affects the number of infected people in the population using State Charts, we can connect the two simulations. This will ensure that the arrivals into the discrete event simulation will depend on the development of the disease that we defined in the Start Charts. We have defined that people will only be admitted or arrive to a clinic once they show major symptoms, i.e. when entering the State ‘Major Illness’.
To do this, we double-click on the State ‘Major Illness’ and on the ‘Events’ tab and choose the Start Point where our Work Items, or patients, arrive at once they enter this State. The drop-down list will be pre-populated with all Start Points in your discrete event simulation.
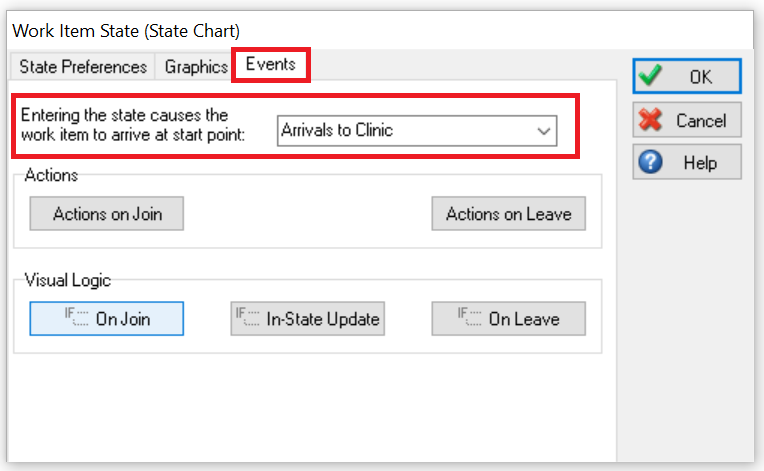
With this setting in place, each time someone in the population enters the State ‘Major Illness’, a Work Item will arrive at the Start Point ‘Arrivals to Clinic’, simulating the admission of that patient with major symptoms. In order to avoid confusion with other arrivals into our hospital, we can set the inter-arrival time of that Start Point to a high dummy value. We could also use additional Start Points to seperate arrivals of non-COVID-19 patients.
I hope you have found this example tutorial helpful and please get in touch if you have more questions.
Case 2: State Charts for including the development of a disease within individual patients and its impact on their treatment process
This second example of State Charts allows for more control and flexibility whenever we want to capture the course of a disease for individual patients and the impact this will have on the process of their treatment. In this example, we want to model how patient health could deteriorate in a hospital to understand how many patients might take longer to treat or if they will need access to additional services.
In the example below, we have again created a State Chart section together with a discrete event simulation.
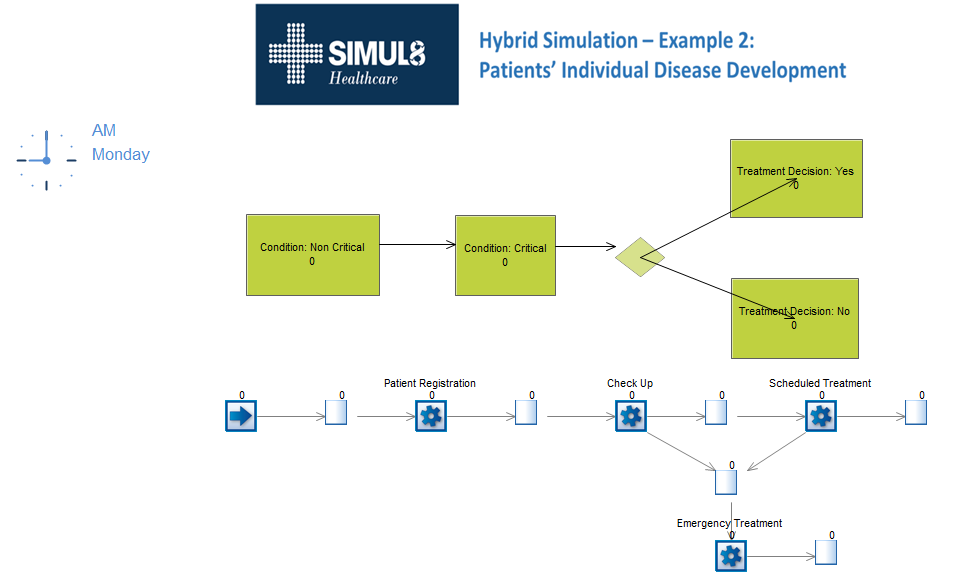
This time, the State Charts represent the development of a disease for an individual patient in continuous time. Like the previous example, the discrete event simulation captures the initial steps within a clinical process, such as undergoing treatment in a hospital or doctor clinic. As before, this can be extended to include any level of detail for your own process.
To set up the State Charts, first ensure you have a State for each stage of the illness and that the possible transitions are captured by the correct Routing Arrows (e.g. from mild symptoms to worse ones, but also vice-versa if that is a possibility). Next, set the transition logic or probabilities in the ‘Transition Out Of State’ dialog as shown in the previous example. Note that in this State Chart model we are also using a Decision Point that determines whether someone decides to seek treatment or not, once they reach the State ‘Condition: Critical’.
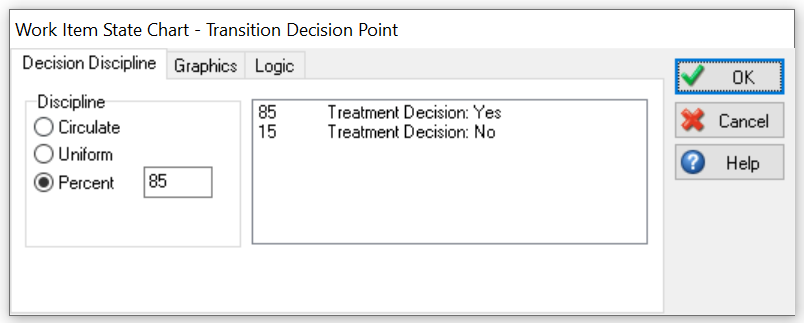
The ‘Decision Discipline’ (found on the top ribbon or when double-clicking the Decision Point), is set so that 85% of patients reaching a critical condition choose to seek treatment while 15% will not. With this in place, we have now implemented the continuous simulation of an individual patient’s course of the disease.
Now, we can connect the two simulations again. For this, SIMUL8 will automatically create a Label for each State when they are added to the State Chart model. This means that we can simply set the Label with the name of the State to 1 at any point in the discrete event simulation in order to add a copy of the Work Item (a patient) to the State Chart section. As the copy transitions independently into other States, all State Labels are updated accordingly and can be used for decisions in the discrete event process.
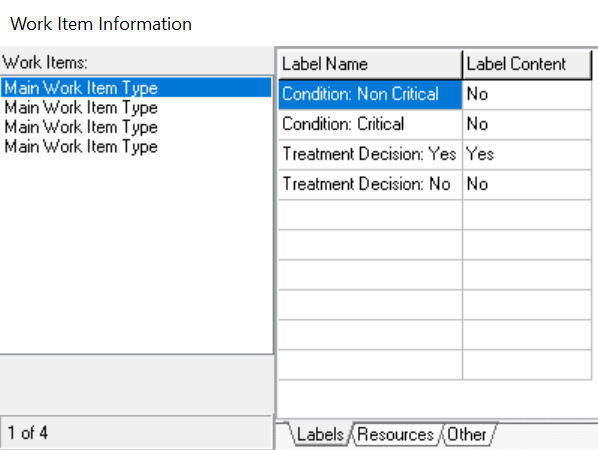
For each arrival at the Start Point we set the Label ‘Condition: Non Critical’ to 1. This is done in the usual way we assign Labels in SIMUL8. This then creates a copy of the Work Item in the corresponding State. From then onwards, both copies are moving independently whereas all State Labels for the Work Item in the discrete event simulation will be shown as Yes or No depending on the State its copy is currently in:
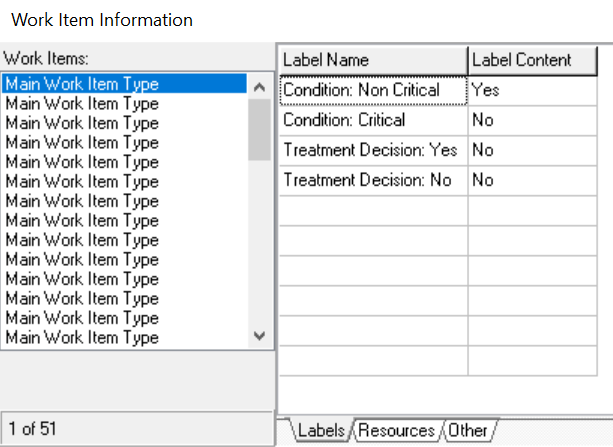
When we inspect the Work Items in the discrete event simulation, we can see that their State Information is captured in the corresponding Labels. In this case, this Work Item is in the State ‘Condition: Non Critical’. At any point in time, if the copy transitions into a critical condition (e.g. by probability per minute), the Label information is updated accordingly.
While the State Charts update in continuous time, we can use this Label information in the discrete event simulation. In this example, we will check whether a patient is in a critical condition and decides to seek treatment at the activities ‘Check Up’ and ‘Scheduled Treatment’. If so, they will be re-routed into the emergency treatment queue, otherwise they will follow to the ‘Scheduled Treatment’ or to the final queue. We can use SIMUL8’s Routing Out by Condition for this, so that if the Label ‘Treatment Decision: Yes’ is 1, route the patient to the emergency queue.
When we run the simulation, we can see that all patients in the queue after ‘Emergency Treatment’ have these Label settings:
Label information can also be used in many other ways than routing in the discrete event simulation – read our help file on using Labels in SIMUL8 to learn about other ways they can be used.
I hope you found this tutorial useful to help in your COVID-19 modeling efforts. During this global emergency, we’re providing support to anyone directly or indirectly working with the healthcare sector. We believe that simulation is an invaluable tool during this time, so please get in touch if there is anything we can help you with.
About the author
Christoph Werner
Christoph Werner has an MSc in Operational Research (distinction) from the University of Strathclyde. In 2018, he completed his PhD. Since 2018, Christoph has been working as part of our Simulation Excellence team where he has helped Simul8 users with numerous simulation projects in automotive, defense, healthcare and other service sectors.