Overall Equipment Effectiveness using Simulation
There are many buzzwords or trends when it comes to Lean Manufacturing. Although, there are some consistent metrics that have been around for decades and still are proving to be useful at improving and maintaining manufacturing capability. Overall Equipment Effectiveness (OEE) is one such metric, that is widely used across all manufacturing sectors. It was developed in the 1960’s by Seiichi Nakajima to support his “Total Productive Maintenance” methodology. The idea behind TPM is to get the plant operators involved in preventive maintenance, thereby maximizing equipment utilization and eliminating waste.
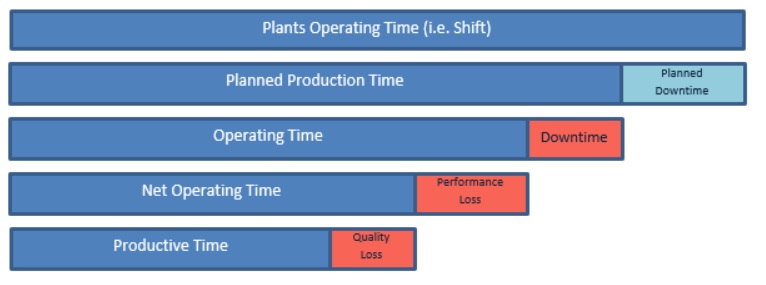
OEE is a metric that strives to get the most out of the plants planned production time by focusing on 3 key factors: Availability, Performance, and Quality. Depicted below are the various time segments that make up a plants production time.

As we can see from the above bar graphs, a plant’s typical working shift can dwindle-down to a relatively small fraction of the shift know as fully productive time. This is after we factor out planned downtime which usually consists of breaks and lunch. The three other contributors are the loss factors that are associated with equipment downtime, performance losses, and quality losses. The availability factor includes equipment breakdowns and is often captured using “Mean Time Before Failures” MTBF and “Mean Time to Repair” MTTR. Equipment over-cycles and start-up losses are significant contributors for performance loss. Often operators can impact the performance metric by adding non-value added seconds onto the ideal or design cycle time. Lastly, scrap and reworked items count as defects creating the quality loss.
OEE is a number between 0 and 1. Where, 1 is perfect effectiveness.
Availability = Operating Time / Planned Production Time
Performance = [Total Jobs / Operating Time] / Design Rate
Quality = Good Jobs / Total Jobs
OEE = Availability * Performance * Quality
Total Jobs is the total number of pieces completed.
Design Rate or Ideal Cycle Time is the theoretical best cycle that a machine can achieve.
Good Jobs do not include defects such as scrapped units or reworked items.
Where do we measure OEE?
OEE can be measured at the station level or the line level. Usually it makes best sense to accommodate the ease of access to collecting the required data. For example, if a particular line has a lock-out procedure that takes down the entire line upon a station failure; then start at the line-level. Either way, it’s important to start with the plants constraint operation or bottleneck. This is the operation that is pacing the facility; limiting the overall throughput to its reduced capability. When an improvement is made at the constraint, it will increase throughput all the way to the pay-point (shipping). OEE can be measured on all lines throughout the plant, but it’s important to focus attention to the constraint operation. This is often an area of failure for several managers; blindly setting high OEE targets across all lines. This can be extremely wasteful and impractical; often OEE metrics differ greatly across manufacturing lines. What is important is understanding the three factors within an OEE metric: Availability, Performance, and Quality and improving upon it at the constraint!
How can OEE be used in a Simulation?
OEE is a natural metric to use within simulation models. Simulation models already are capturing all of the required data with respect to availability, performance, and quality! Let’s take a look at the above SIMUL8 simulation model of a facility with four manufacturing lines.
Simulation Set Up
Plant’s Operating Time:
Runtime: 4 weeks (M-F)
Shift Pattern: 15 minute morning break, 30 minute lunch, 15 minute afternoon break
Shift: 8.5 Hours
Availability factors:
Each line is in a SIMUL8 Group using multiple breakdowns.
Line 1 and Line 4 have Change Overs according to number of cycles.
Performance Factors:
Line 2 has an over-cycle condition where it can cycle above its ideal cycle time.
Line 3 has a shared resource that can pace the line.
Quality Factors:
Line 2 has a rework loop that sends pieces back to Line 1.
Line 3 has a reject percentage of scrap.
This example simulation is also capturing the Stand-Alone JPH for each line. That is the average net Jobs per Hour for each line if it was running by itself. That is a good indicator of the lines maximum capability. Therefore, Line 3 is the bottleneck operation with a stand-alone JPH of 38.7 JPH and an OEE of 0.39.
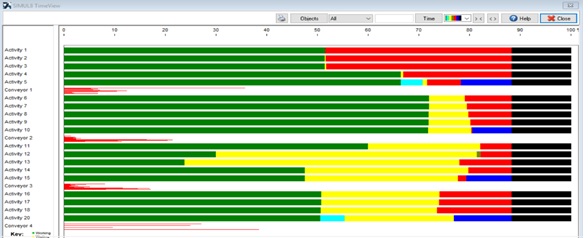
The below chart is a snapshot of all the activities within the above simulation model. OEE is closely related to the “Working” state depicted in the green bars. The black bars represent “Planned Downtime” which include breaks and lunch. Random equipment downtime is captured within the blue bars; this represents downtime losses. Activities 5 and 20 have a small portion of time for changeovers which impact availability. Lastly, some of the performance losses are captured within the Wait (yellow) and Blocked (red) conditions.

Similar to improving OEE at the constraint on the shop floor; here in the simulation analysis we are typically attempting to maximize the working state. Above, we can see that the constraint operation Line 3 with an OEE of 0.39; is causing significant losses attributed to wait & blocks to downstream operations at Line 3 & Line 4. Simulation analysis can provide predictions for all of your company’s metrics including OEE, but it can also provide great insight into the interrelationships of how assets are performing with one another. This time-in-state view (SIMUL8’s Timeview) is an effective tool for applying “Theory of Constraints” and pinpointing potential bottlenecks within the system. Like Timeview, OEE is a metric which can add clarity to the interrelationships between Availability, Performance, and Quality.
Where are the OEE factors captured within the Simulation?
Let’s start with Availability. The Availability is captured within SIMUL8’s unique states “Down” and “Change Over”. Hence, we can add those two states percentages together, and subtract that figure by 1 to obtain the Availability factor.
The Performance factor is calculated by the equation: Total Jobs/Operating Time] / Design Rate. SIMUL8 automatically tracks total jobs completed within its results tab, and the operating time is nothing more than the [Simulation Time – Off Shift Time – Downtime – Changeover Time]. These can all be captured using SIMUL8’s “Get Result command”.
Quality is easily derived through counts of scrapped items and counts of reworked items.
Can you perform What If Analysis and Improve OEE?
Download the simulation model below and see if you can improve throughput. Keep track of the systems overall throughput and see how the OEE factors change per scenario. The 3 buttons on the simulation allow you to easily enter new factors for Availability, Performance, and Quality via the depicted dialog boxes.